Based on our data, Biden has seen a significant increase in support over the last four polls, while the number of undecided voters has significantly decreased.
Article originally published by Brandwatch here.
How are people rating Trump's Covid-19 handling?
Welcome to our 7th US Election bulletin. It comes as millions cast early votes and Trump returns to the campaign trail after being ill with Covid-19. This week we’re looking at the issues voters think are most important, and how Americans view Trump’s response to the pandemic.
Let’s get to it.
The results: Joe Biden: 51%, Donald Trump: 37%, undecided: 8%
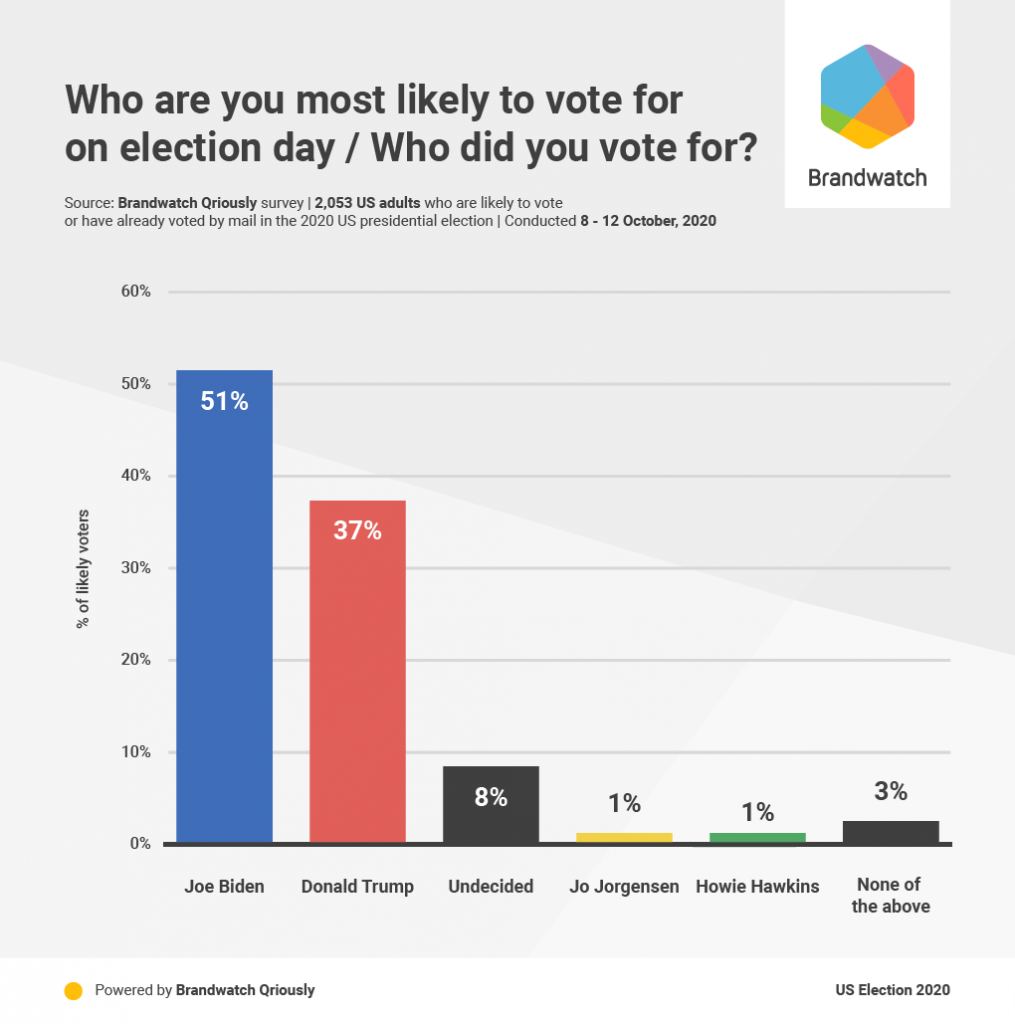
Using Brandwatch Qriously, we surveyed 3,048 American adults from October 8 to October 12 2020. The above results come from the 2,053 respondents who say they are likely to vote or have already voted in November’s election. (After weighting, this is 54.4% of the overall sample).
Biden leads with 51% of respondents supporting him, against Trump’s 37%, a margin of +14. A further 8% of likely voters say they’re undecided, meaning there are still many Americans yet to back a candidate.
Biden currently has the largest lead we’ve recorded so far, while the number of undecided voters are at their lowest too.
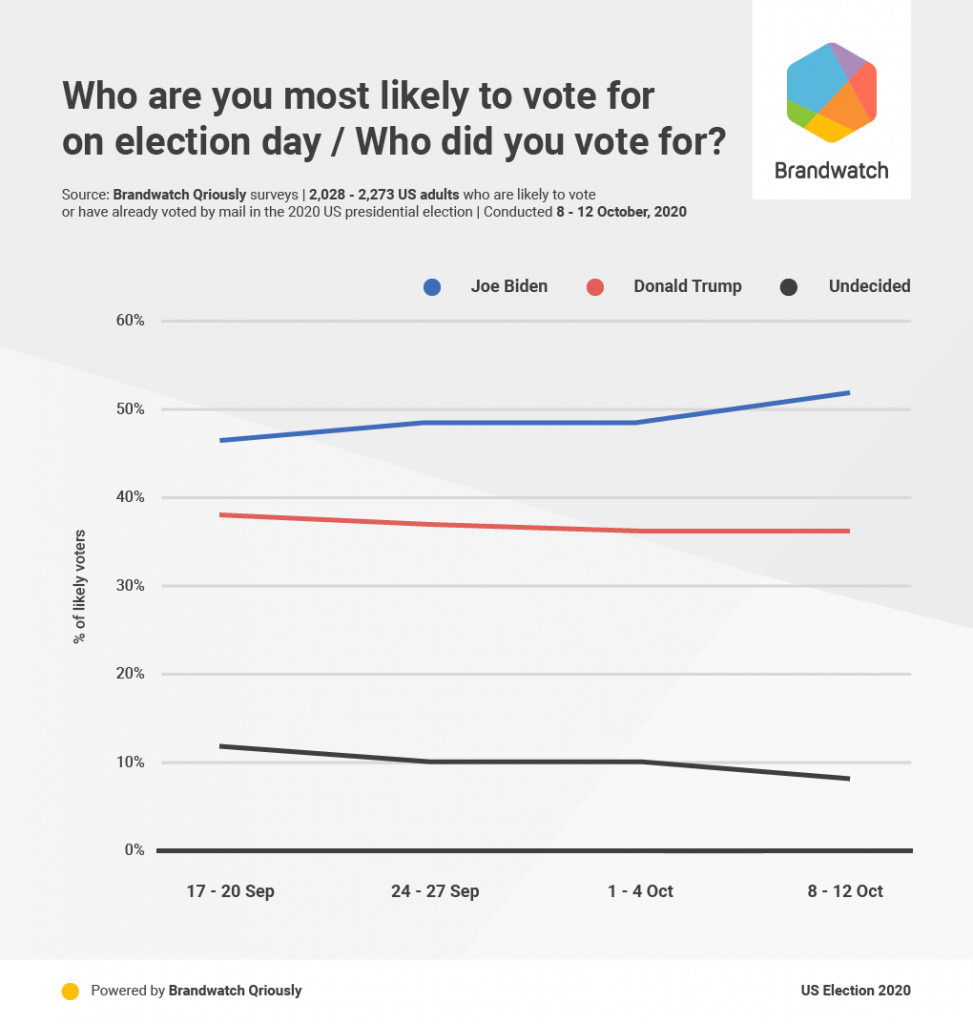
Based on our data, Biden has seen a significant increase in support over the last four polls, while the number of undecided voters has significantly decreased. Trump’s support on the other hand has remained relatively stable.
As we do every week, we’re releasing our polling data along with our bulletin. If you want to have a dig around or do your own analysis, you can find our tables and the raw data here.
The undecided start to decide
As we get closer to election day, we’ve seen the number of undecided voters fall to just 8% of likely voters. Along with time putting on the pressure to choose, another contributing factor to this could be previously undecided people voting early.
This group of undecided likely voters still have their part to play though. To find out how they are leaning, we asked them “If you had to choose a candidate today, who would you vote for?”
This week we found 11% are favoring Trump, and 8% are leaning towards Biden. A further 1% picked third party candidates or none of the above, leaving 80% still undecided.
If we included the answers to this question in our headlines figures Biden would have an overall vote share of 52%, Trump would be on 38%, while 4% would opt for a third party candidate or “None of the above”, leaving 6% undecided.
The big issues
What’s an election without the issues?
This week we presented our respondents with a list of “issues”, asking them to pick up to three which they considered the most important. When we look at likely voters only, we can see which issues may be on people’s minds at the ballot box.
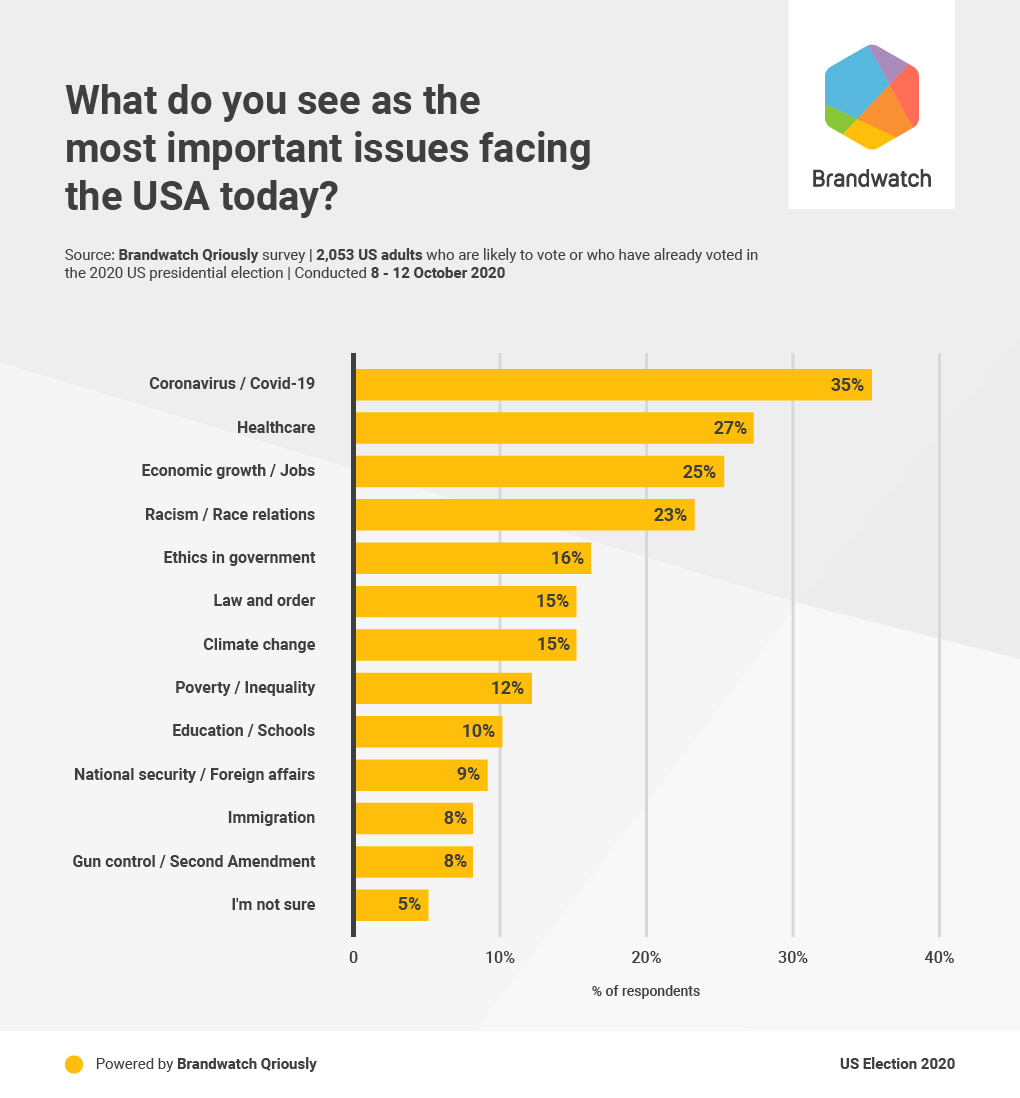
Covid-19 comes top by a decent margin, but falls far short of being a main concern for the majority of voters (35%). Healthcare (27%), economic growth/jobs (25%), and racism/race relations (23%) follow behind it, all being picked by around a quarter of likely voters.
Arguably healthcare, economic growth, and jobs are intrinsically linked to Covid-19 too, which suggests that while no issue dominates entirely, the pandemic and its fallout is heavily influential on voters.
Of course these issues are just the start. The candidates have to offer solutions and a platform to tackle them. In doing so they hope to get their base to the polls, and pull voters from one side of the aisle to the other.
We can split out the issue by voting intention to find the areas Biden and Trump may need to focus on.
There is little common ground, and this is especially true for the “bigger” issues. Where 50% of likely Biden voters picked Covid-19, just 17% of likely Trump voters picked it. Where 41% of likely Trump voters picked economic growth/jobs, just 14% of likely Biden voters did the same. “Law and order” also saw lots of picks from likely Trump voters, something he’ll be happy with after recently putting a big push behind the issue.
We know this election has been, and will be, polarizing, but what this shows is that even with issues that affect everyone, like Covid-19 or the economy, they’re unlikely to offer much hope for national reconciliation and agreement.
Speaking of Covid-19, you won’t have missed that Trump contracted it recently, and now claims he is fully recovered. The story was obviously massive.
For context, our BuzzSumo data found 3.6m social engagements with, and shares of, articles on this story. In comparison, articles about Hilary Clinton’s pneumonia in 2016 got just 1.1m.
With Trump back on the rally circuit, we wanted to find out what people thought of his response to the pandemic, and of the White House outbreak itself.
Rating Trump's Covid-19 response
There may not be consensus on the issues, but we did find some alignment on this topic.
But does this translate to who people think should be in charge?
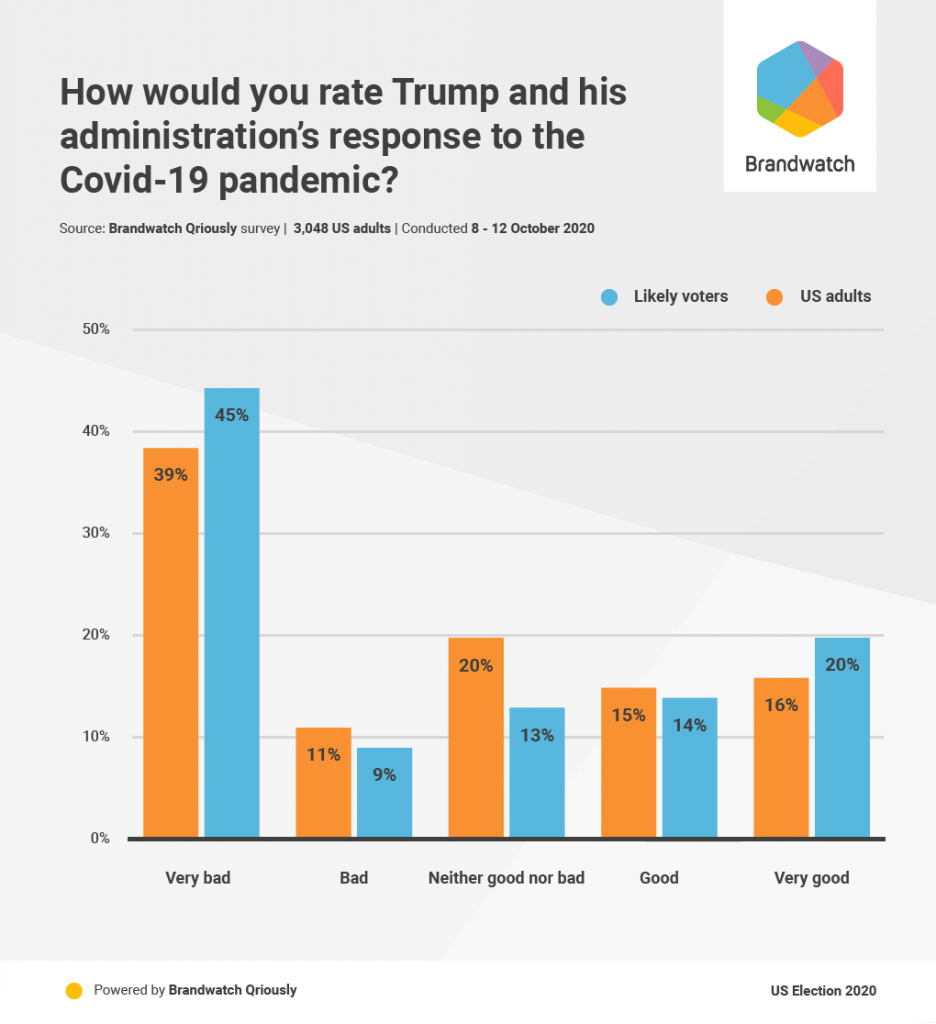
It’s not looking good for Trump with 54% of likely voters and 50% of US adults having a negative view of his handling of Covid-19.
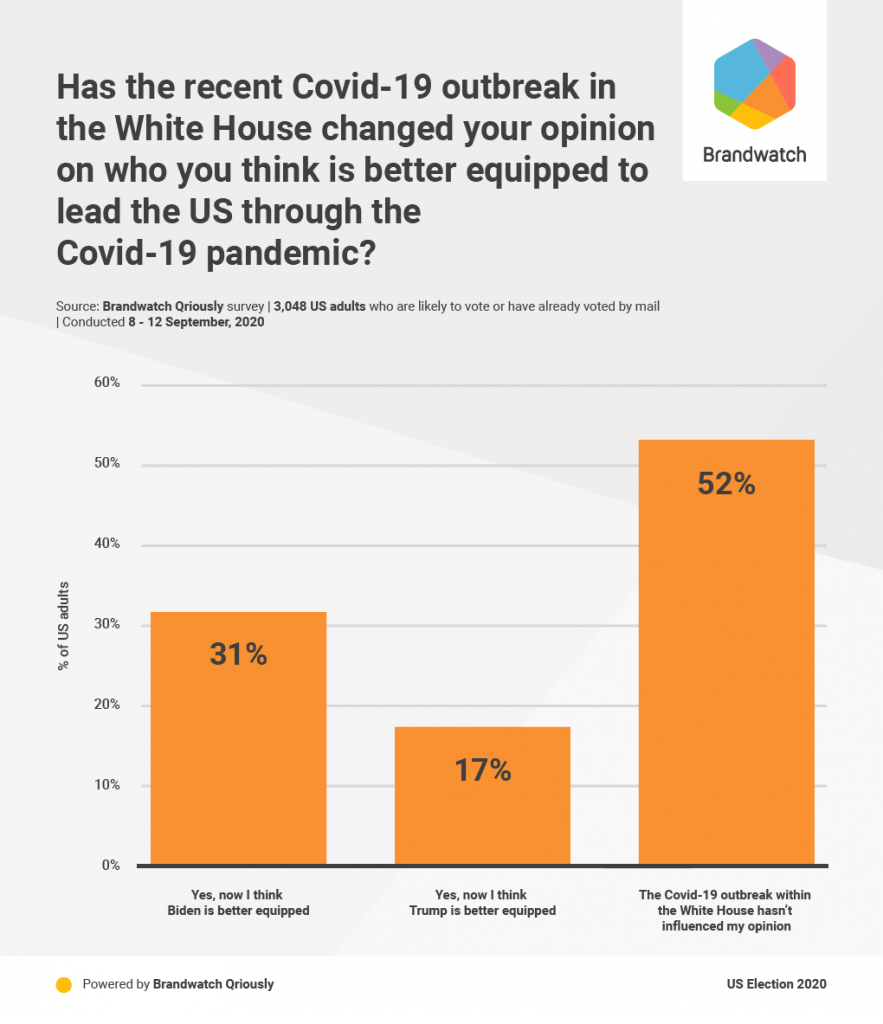
Not as much as you might think. Just over half of US adults (52%) state that the outbreak of Covid-19 in the White House didn’t change who they thought should lead the US for the outbreak. Meanwhile 17%, now think Trump is better equipped for the job, an argument he has put forward himself.
We also looked at how people’s experience with Covid-19 shaped their view of the Trump administration’s response to it.
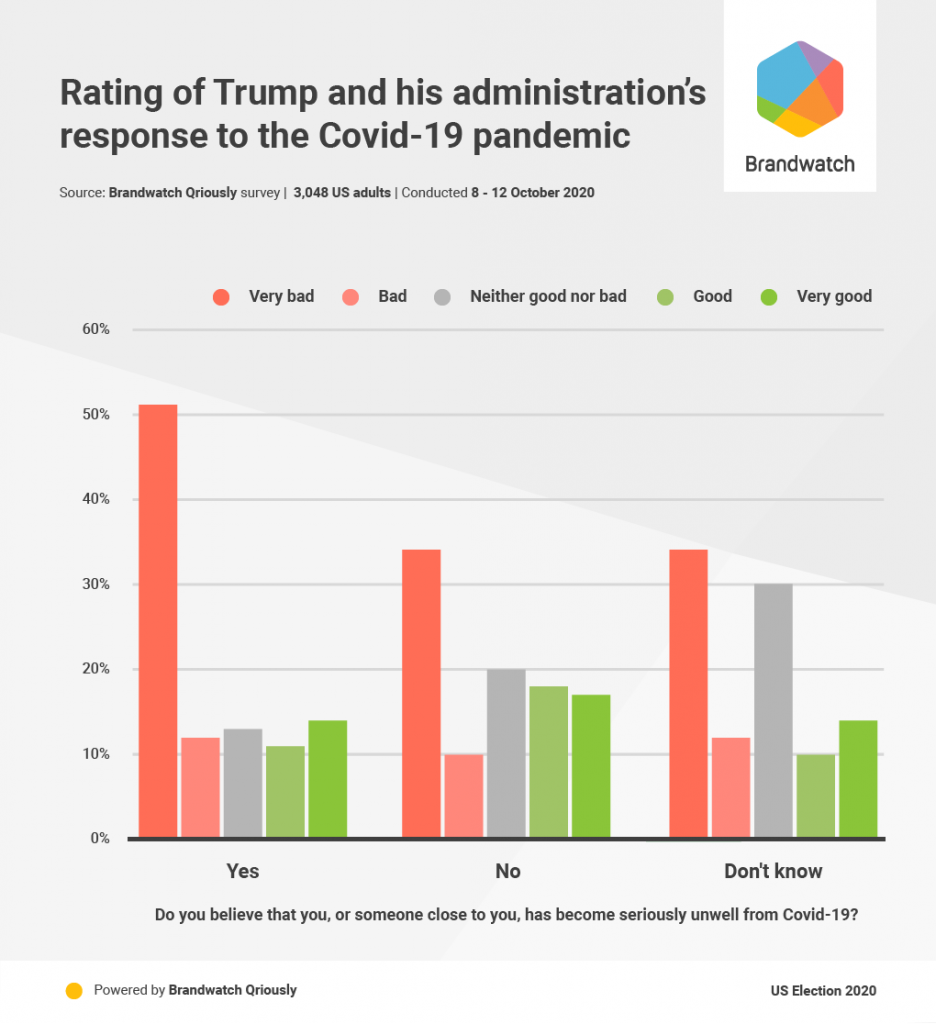
Our data shows that those who have gotten severely ill with Covid-19, or know someone who has, are more likely to view Trump’s response to the pandemic in a negative light. Our survey found 27% of US adults said they’d had either experience, and while not a majority, that’s over a quarter of American adults who are likely to view the president’s actions in a more negative light.
What this adds up to is a big problem for Trump’s re-election chances. His approach to the pandemic is seen negatively, especially so with the growing number of people who personally experience the virus. With Covid-19 being the most important issue amongst voters, this should be cause for concern for his campaign.
The preferred Covid-19 response
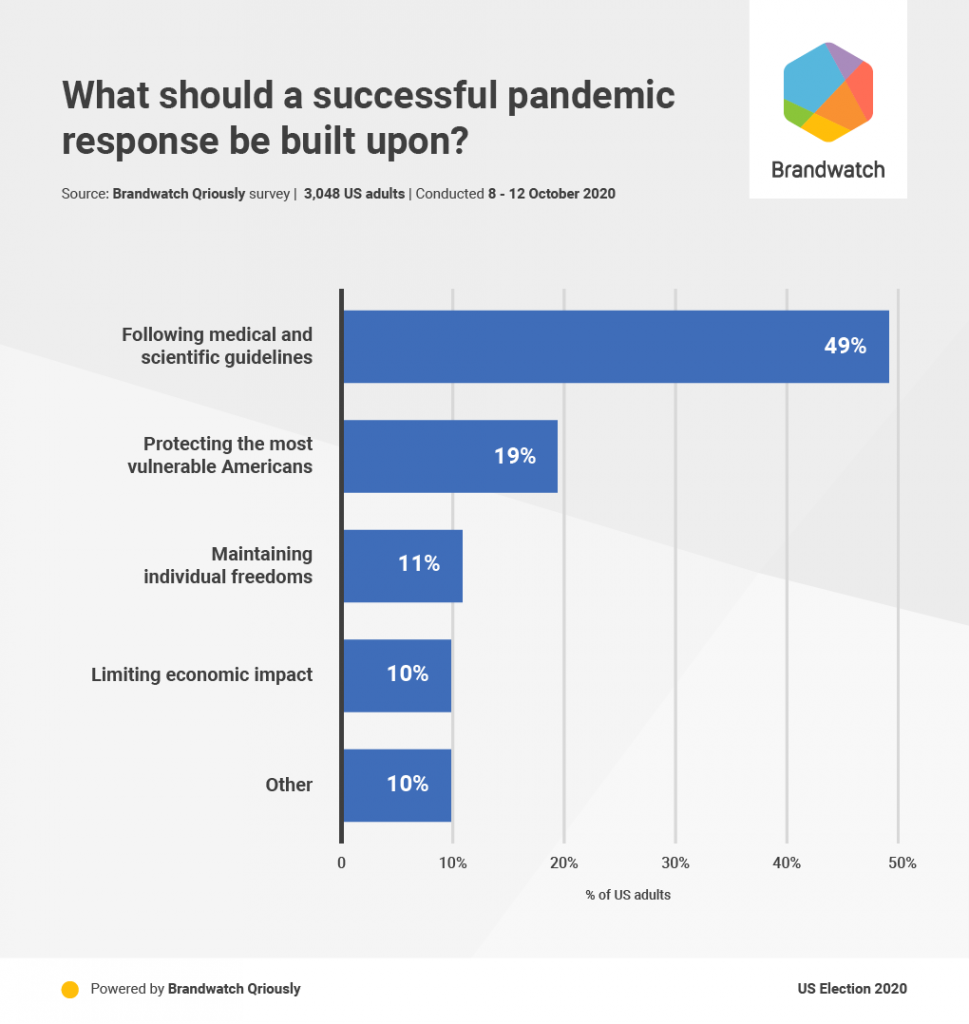
If people are unhappy with Trump’s approach, what approach do they want?
Just under half of US adults want a pandemic response based on medical and scientific guidelines. This is by far the most popular choice, suggesting people want action taken based on facts and research, rather than politics.
Although it is safe to assume that those wanting the government to follow medical and scientific guidelines, would expect this to lead to some or all of the other approaches we listed sooner or later.
Ultimately, Americans don’t want a “finger in the air” approach. They want one built on strong science and thought-out reasoning.
A guide to opinion polls
You may be reading these bulletins and wondering how these polls work, how to interpret them, and whether they’re really any good. Luckily, the British Polling Council, of which we’re a member, has put together an informative guide answering these questions and others.
While aimed at journalists and from a British organization, we think our readers will get a lot of value out of reading it. Polling data is far more valuable and informative when we understand it.
Keep your finger on the world's pulse
Every Monday and Friday we send out our Brandwatch Bulletin, giving you data and analysis on current events, consumer trends, and everything in between.
Thanks for reading
As the Australian and New Zealand agency partner for Brandwatch we support leading enterprises and government in the region with AI-based technology for insight and strategy, and are trusted by numerous other agencies with our expertise in digital consumer intelligence and social analytics to deliver client success. Connect with us to explore how we too can support your brand (or your clients) with data-driven creative or strategy.
Data and methodology
Detailed tables and raw data are published here. Data is released under the Open Data Commons Attribution License (ODC-By) v1.0. If you are publishing or using this data you must give attribution to Brandwatch Qriously.
Brandwatch Qriously uses river sampling and delivers market research questions to respondents via ads on mobile device apps. The proportion of respondents recruited in a particular app is determined by the demographic of its users, which allows for the collection of representative samples. There are no incentives, meaning participants are more likely to provide candid and accurate responses. Qriously has successfully predicted nine major elections. It offers an accurate, fast, and reliable way to conduct market research, even within hard-to-reach groups and countries.
About the poll: 3,048 adults aged 18+ nationwide were surveyed from October 1 October 4 2020. The size of the subsample of likely voters was 2,053. Data was weighted to be nationally representative in terms of age, gender, education, race, geographical region (census division), and NCHS urban/rural community type, using data from the Census Bureau’s American Community Survey (ACS), as well as 2016 Presidential election vote (or non-vote). Targets for 2016 vote were calculated using results from the Federal Election Commission, population totals from ACS and mortality data from the National Centre for Health Statistics. The margin of error at the 95% confidence level, taking into account the effect of weighting, is +/- 2.4 percentage points for estimates from the full sample. For the subsample of likely voters it is +/- 2.8 percentage points. Sampling error can be larger for subsets of these samples. In addition to sampling error, all polls are subject to a range of other potential sources of error. When percentages do not sum to 100% this is due to the effect of rounding.